
Introduction
In the intricate realm of Linux system administration, having a firm grip on essential commands is paramount. Among the arsenal of tools at your disposal, the ‘top’ command stands tall as a stalwart in monitoring and managing system resources efficiently. In this comprehensive guide, we will delve into the intricacies of the top command in Linux, exploring its functionality and providing hands-on examples for a thorough understanding.
How to use a top command in Linux

Invocation of the ‘top’ Command:
To initiate the ‘top’ command and gain an instant overview of your system’s performance, open your terminal and execute:
Top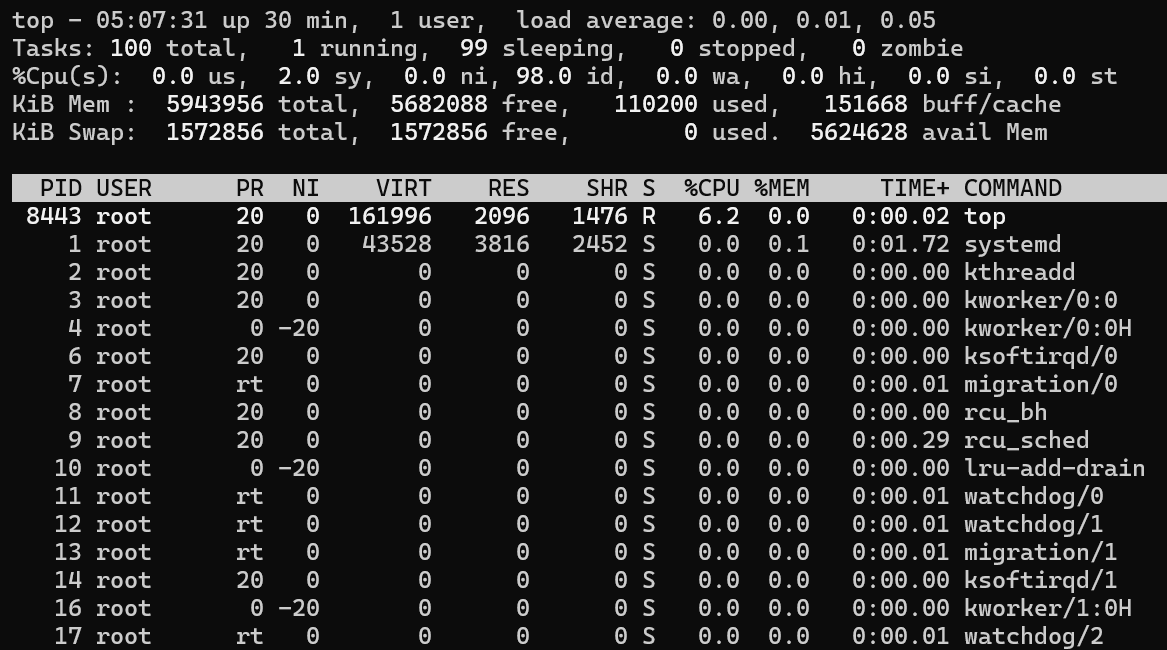
This command unveils a dynamic, real-time display of key system metrics, including CPU usage, memory allocation, and an exhaustive list of active processes. The interactive interface allows users to navigate seamlessly, offering a comprehensive snapshot of the system’s health.
For a more granular understanding, the ‘top’ command segregates the displayed information into sections, including the summary area at the top showcasing global statistics, followed by a detailed process list below. The color-coded interface distinguishes between various types of resource usage, aiding quick identification of potential bottlenecks or resource-hungry processes. This user-friendly design streamlines the monitoring process, making the ‘top’ command an indispensable tool for both novice and seasoned administrators alike.
Top Command Syntax and Options

Understanding the syntax and options of the ‘top’ command is pivotal for optimizing its functionality to suit specific monitoring needs. Here, we delve into additional options that enhance the versatility of the ‘top’ command:
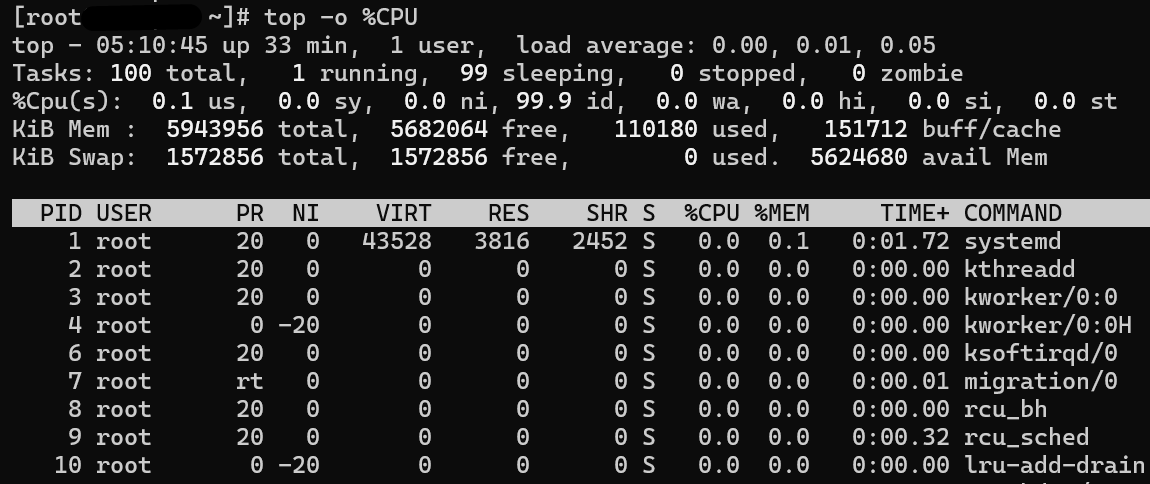
1. Sorting Processes by CPU Usage:
top -o %CPUThis option orders processes based on CPU usage, facilitating the identification of resource-intensive tasks and enabling proactive management of system resources.
2. Filtering Processes by User:
7top -u username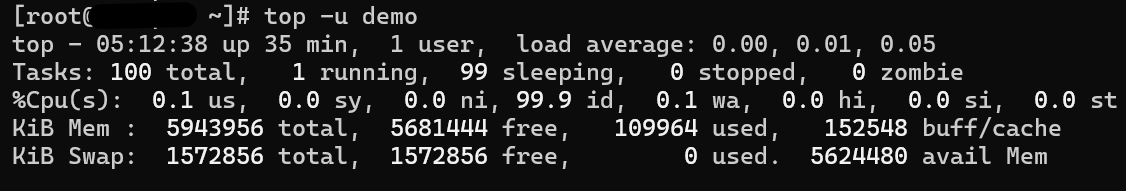
By specifying a username, administrators can focus on processes associated with a particular user, aiding in efficient user-level monitoring. This capability is especially valuable in multi-user environments.
3. Comprehensive Command Line Overview:
top -c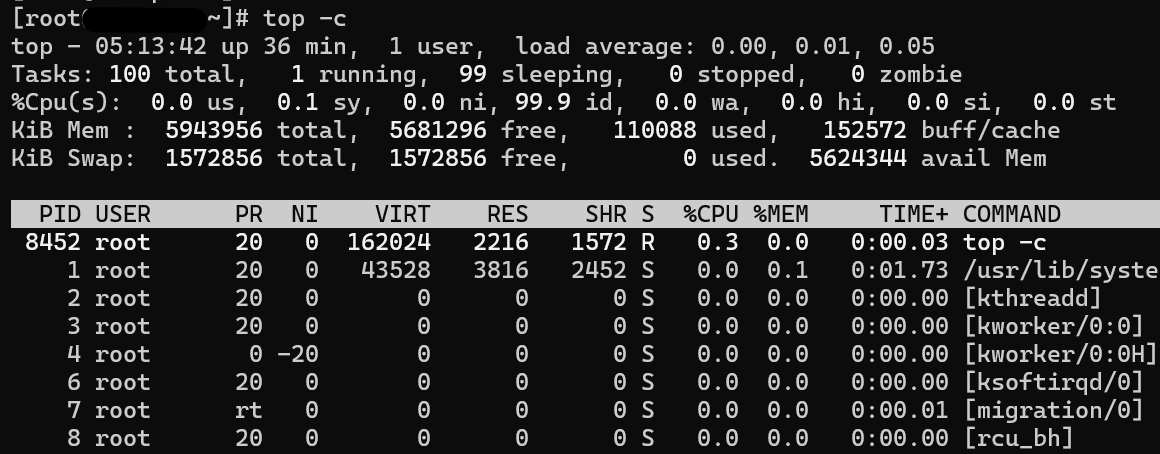
The ‘-c’ option provides an extensive display of command lines associated with running processes, offering granular insights into the execution of tasks. This detailed overview aids in troubleshooting and optimizing resource utilization.
4. Highlighting Running Tasks:
top -b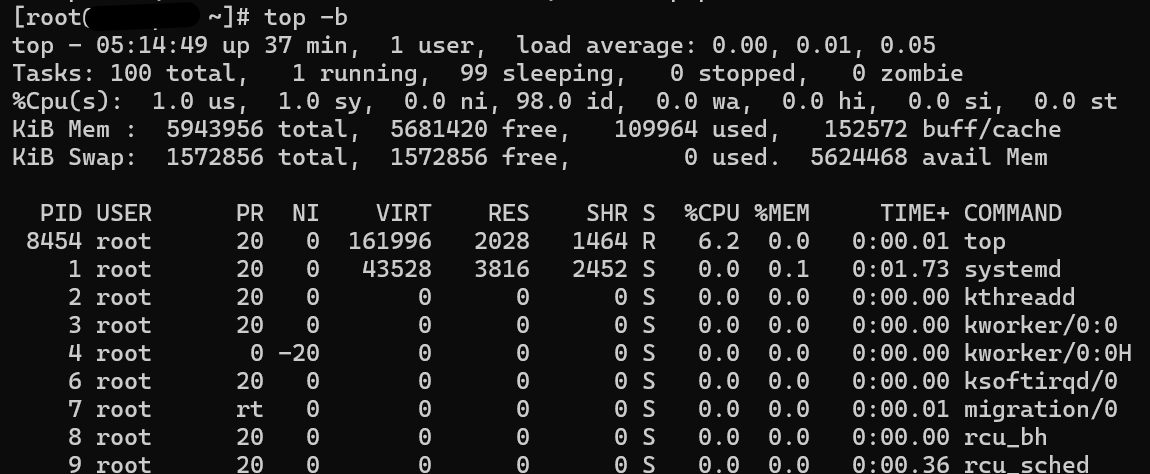
Adding the ‘-b’ option initiates ‘Batch Mode,’ where the ‘top’ command operates without the interactive interface. This is advantageous for scripting and automated monitoring, allowing for streamlined data extraction.
5. Sorting Processes by Memory Usage:
top -o %MEM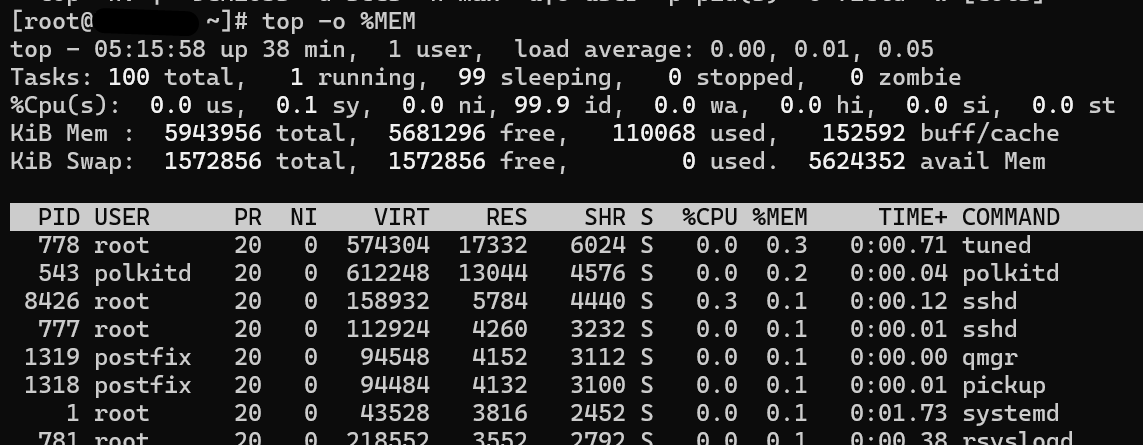
Similar to CPU sorting, the ‘-o %MEM’ option organizes processes based on memory usage, aiding in the identification of memory-intensive tasks for efficient resource management.
6. Highlighting Threads:
top -H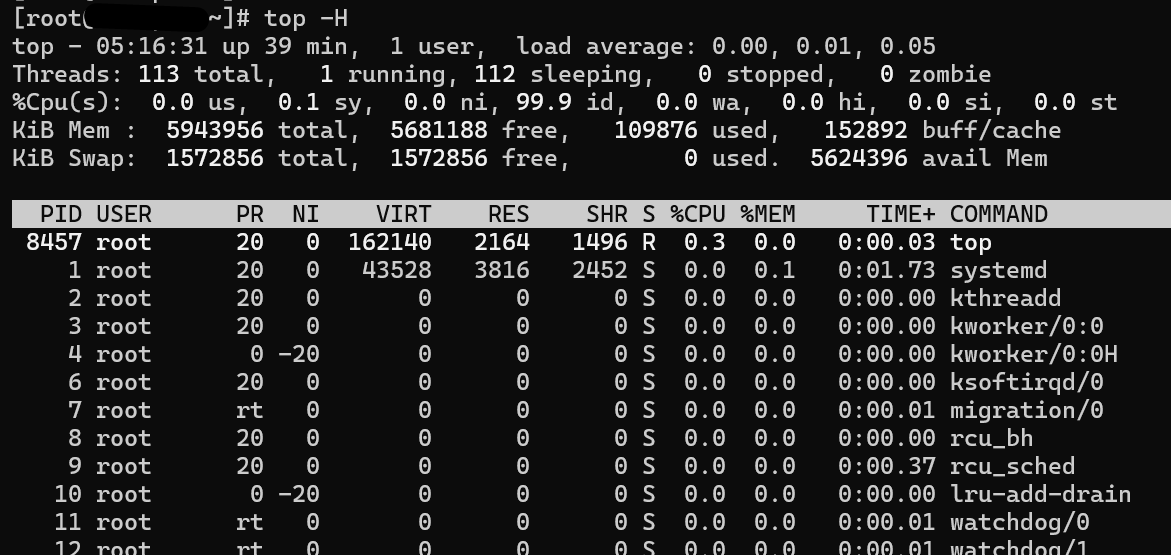
Activate the ‘-H’ option to display individual threads associated with processes. This is invaluable for in-depth analysis of multithreaded applications and their resource consumption.
Also Read: A Complete Guide to useradd Command in Linux with Examples
Top Command Examples

Let’s delve into practical examples to illustrate the versatility of the ‘top’ command and its application in real-world scenarios:
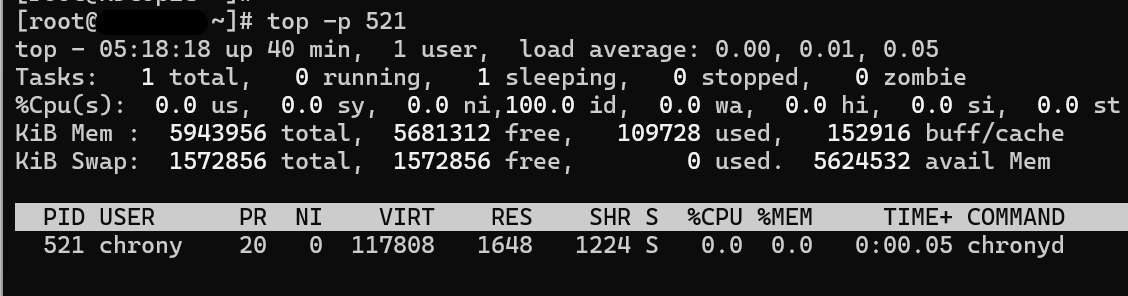
1. Monitoring Specific Processes:
top -p PID1,PID2,PID3Replace PID1, PID2, and PID3 with the specific process IDs you want to monitor, enabling focused attention on critical tasks. This targeted approach is invaluable for maintaining system stability.
2. Monitoring CPU and Memory Usage of a Specific User:
top -u usernameTailor your monitoring efforts by focusing on processes associated with a particular user. This command provides a comprehensive view of CPU and memory usage specific to the specified user, aiding in user-level resource management.

3. Monitoring Processes and Threads:
top -H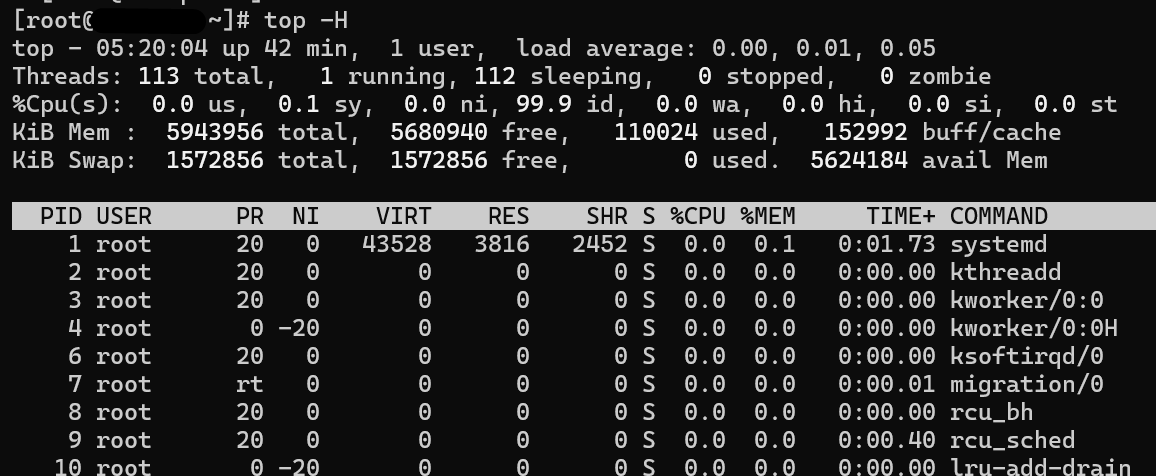
Activate the ‘-H’ option to display individual threads associated with processes. This is particularly useful when troubleshooting multithreaded applications, allowing a more granular analysis of resource utilization.
4. Monitoring and Sorting Processes by Virtual Memory Usage:
top -o VIRT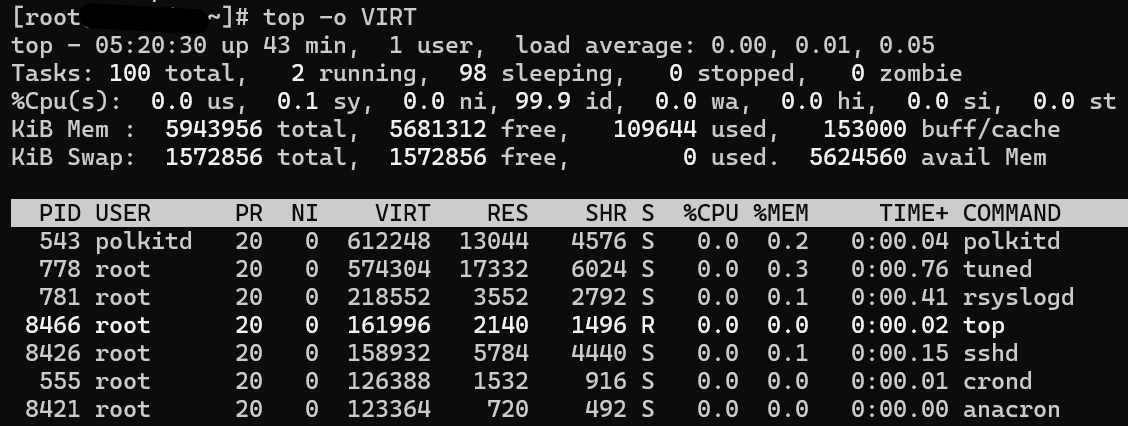
Sort processes based on virtual memory usage with the ‘-o VIRT’ option. This is beneficial when identifying processes with high virtual memory requirements, aiding in efficient memory management.
Also Read: 50+ Linux Commands with Screenshots
Final Words
The ‘top’ command emerges as an indispensable sentinel, providing real-time insights into CPU usage, memory allocation, and process dynamics. Mastering its nuances transcends utility, transforming it into a strategic asset for adept administrators navigating the complexities of Linux environments. From tailored customization to practical applications in diverse scenarios, the ‘top’ command proves its mettle as a chameleon, adapting to meet the dynamic needs of Linux professionals. Whether troubleshooting multithreaded applications, optimizing resources, or orchestrating well-tuned Linux ecosystems, the ‘top’ command stands as a catalyst for efficiency and mastery, elevating system administrators to virtuosos of system performance.
As administrators delve into the art and craft of ‘top’ command mastery, they unlock a Swiss Army knife for system monitoring. This command is a spectator and an active participant in the orchestration of resilient Linux ecosystems. Its adaptability ensures relevance across diverse use cases, making it a cornerstone for those seeking excellence in Linux system administration.


